Create boxfill/imshow plots
Table of Contents
The Boxfill and Pcolor classes
A boxfill/imshow plot is created by defining a base_utils.Boxfill
plotting method, and passing it to the base_utils.Plot2D
constructor or the base_utils.plot2() function.
All the input arguments to the __init__() method of
base_utils.Boxfill are the same as those in
base_utils.Isofill:
varssplitmin_levelmax_levelqlqrvcentercmap
More explanations of these arguments are given in Create isofill/contourf plots.
The base_utils.Pcolor class shares the same signature as
base_utils.Boxfill, and their usages are also identical.
(Honestly, is there any difference between the two?)
Basic plot example
A boxfill/imshow/pcolormesh plot is also relatively easier to create. See a simple example below:
import matplotlib.pyplot as plt
import gplot
from gplot.lib import netcdf4_utils

var = netcdf4_utils.readData('msl')
lats = netcdf4_utils.readData('latitude')
lons = netcdf4_utils.readData('longitude')

figure, axes = plt.subplots( figsize=(12, 6), nrows=1, ncols=2,
        constrained_layout=True)
box = gplot.Boxfill(var1)
pc = gplot.Pcolor(var1)
gplot.plot2( var1, box, axes[0], title='default Boxfill', projection='cyl',
        legend='local')
gplot.plot2( var1, pc, axes[1], title='default Pcolor', projection='cyl',
        legend='local')
figure.show()
The result is given in Fig.6 below:
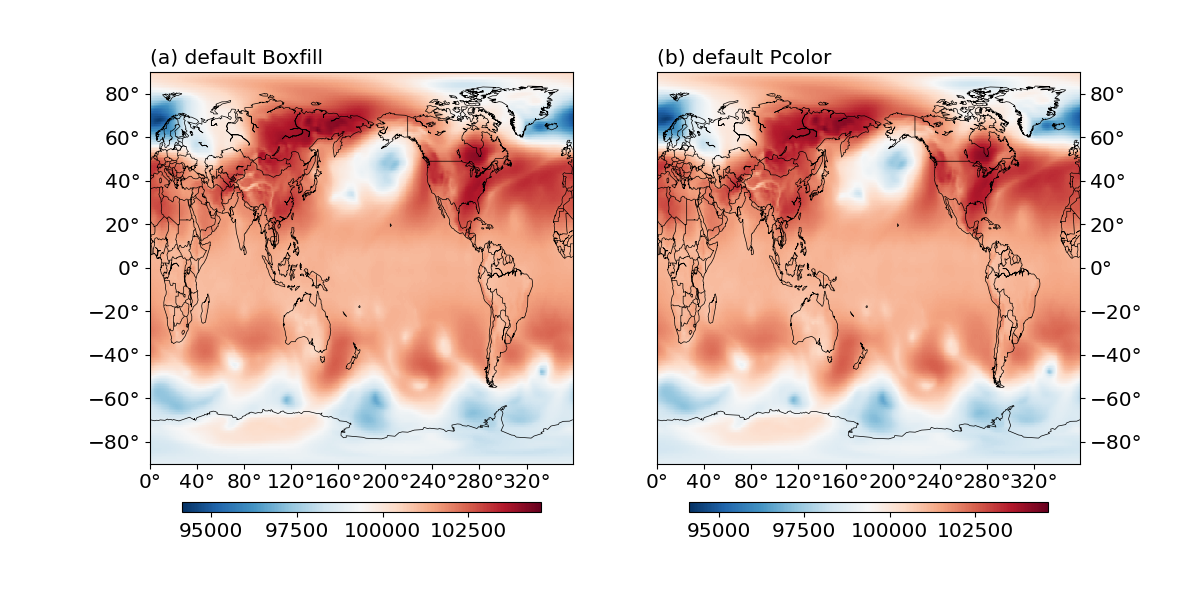
Fig. 6 Boxfill (a) and Pcolor (b) plot examples.
The mappable object
Same as an isofill/isoline plot, the mappable object of a
boxfill/imshow/pcolormesh plot is stored as an attribute of the
base_utils.Plot2D (or basemap_utils.Plot2Basemap)
object. See The mappable object.