Add colorbars to plots
Table of Contents
Positioning of the colorbar
A colorbar is automatically added for an Isofill/contourf, a Boxfill/imshow and a polychromatic Isoline/contour plot.
The positioning of the colorbar is controlled by the legend keyword argument
to the base_utils.Plot2D.__init__(), or the
base_utils.plot2() function. It can have 1 of the 3 possible values:
legend = 'global': the default. If there are more than 1 subplots in the figure, all subplots share the same colorbar, which is created by the 1st subplot. If only 1 subplot in the figure, same aslegend = 'local'.legend = 'local': subplots in the figure have their own colorbars.legend = None: don’t plot the colorbar.
Note
gplot at the moment does not support colorbars that are shared by a subset of the subplots, like in the examples given in the matplotlib tutorial.
Additionally, the legend_ori argument specifies the orientation of the colorbar:
legend_ori = 'horizontal': horizontal colorbar.legend_ori = 'vertical': vertical colorbar.
Note
Only the right (for vertical colorbar) and bottom (for horizontal colorbar)
side of the subplot/figure placement are supported. Top and left side
placement are not supported in gplot. However, one can create the colorbar
on their own, by setting legend = None, and using the returned mappable
object.
Overflows on a colorbar
Overflow is represented by a triangle on either end of the colorbar (see Fig.7 below for an example). It signals that all values below the minimum overflow level are represented by the color of the left triangle, and all values above the maximum overflow level by the right triangle. Namely, one chooses to selectively plot only a sub-range of the data values.
Overflows are ONLY added if the range of data exceeds the range plotted.
And they can be introduced by setting the min_level or ql arguments (for
the left overflow), and the max_level or qr arguments (for the right
overflow).
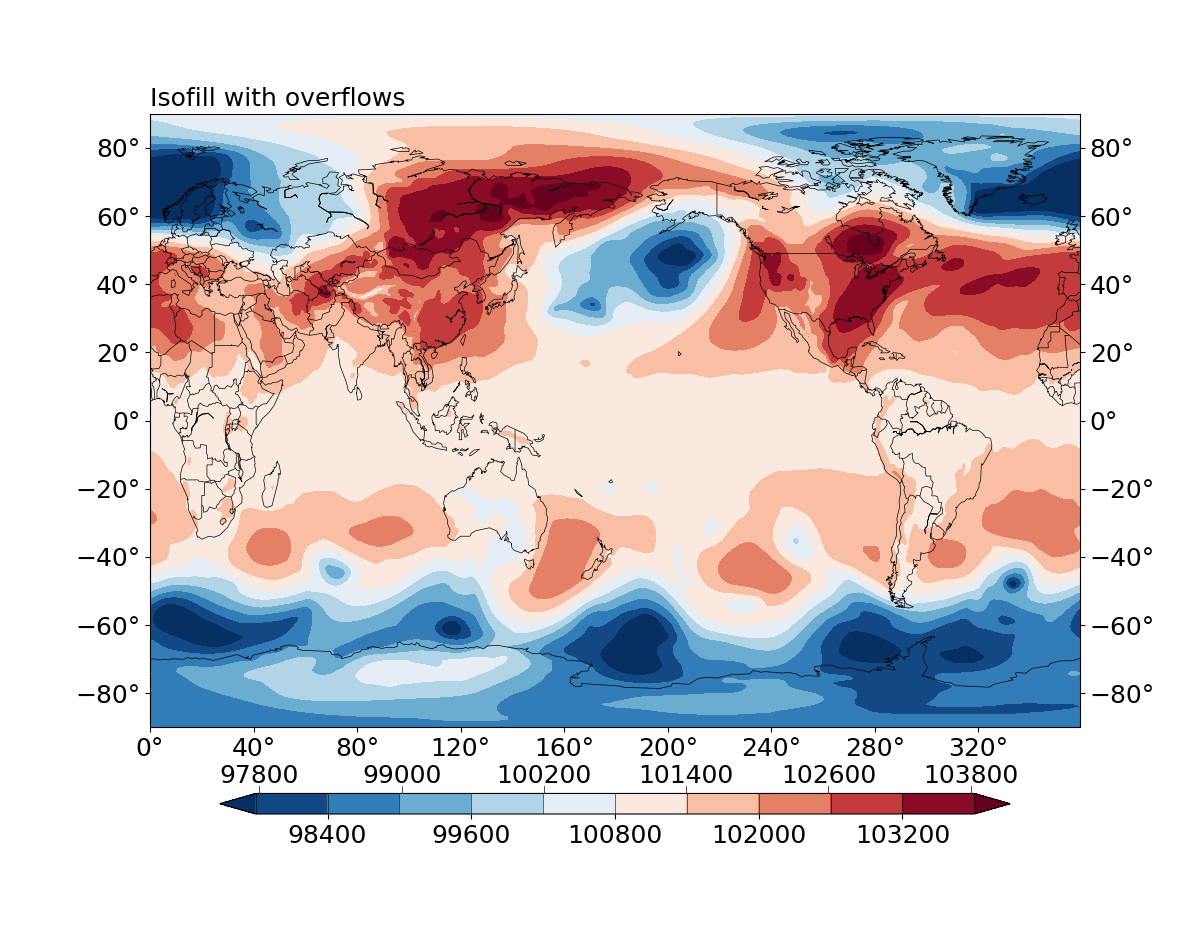
Fig. 7 Isofill plot with overflows on both sides.
Alternating top and bottom ticks of a horizontal colorbar
In an Isofill/contourf plot, if the number of levels is too big, the tick labels of a horizontal colorbar may start to overlap with each other. In some cases this can be solved by putting half of the tick labels on the top side and half on the bottom side (see Fig.7 above or this figure for examples).
This functionality is automatically enabled, but only for Isofill/contourf plots with horizontal colorbars.
Note
If the number of contour levels keeps on growing, the tick labels may start to overlap again. In such cases, it is worth trying either reducing the level numbers, or using a smaller font size.