Welcome to Gplot’s documentation!
Table of Contents
Introduction
Gplot is a (thin) wrapper around matplotlib, basemap and cartopy for quick and easy creations of geographical plots. It is designed to create publish-ready figures with as few lines as possible, while preserving the possibility to fine-tune various aspects of the plots.
Installation
Install from conda
gplot can be installed in an existing conda environment using:
conda install -c guangzhi gplot
This will install gplot and its dependencies for Python 3.
Dependencies
Mandatory:
OS: Linux or MacOS. Windows is not tested.
Python: >= 3.
numpy
matplotlib: developed in 3.2.2. NOTE that versions later than 3.2.2 are incompatible with basemap.
Optional:
scipy: optional, developed in 1.2.1. For 2D interpolation in quiver plots only.
For plotting the geography: basemap or Cartopy.
basemap: developed in 1.2.0.
Cartopy: developed in 0.16.0, not fully supported yet.
For netCDF file reading: netCDF4 or CDAT or xarray or iris.
netCDF4: developed in 1.5.5.1.
the cdms module of CDAT: developed in 3.1.5.
xarray: not supported yet.
iris: not supported yet.
Quick start
After installation of gplot and basemap, create an isofill/contourf plot of the global sea level pressure field (sample data included in the installation) using the following snippet:
import matplotlib.pyplot as plt
import gplot
from gplot.lib import netcdf4_utils

var = netcdf4_utils.readData('msl')
lats = netcdf4_utils.readData('latitude')
lons = netcdf4_utils.readData('longitude')

figure = plt.figure(figsize=(12, 10), dpi=100)
ax = figure.add_subplot(111)
iso = gplot.Isofill(var)
gplot.plot2(var, iso, ax, xarray=lons, yarray=lats,
            title='Default basemap', projection='cyl',
            nc_interface='netcdf4')
figure.show()
The output is given below:
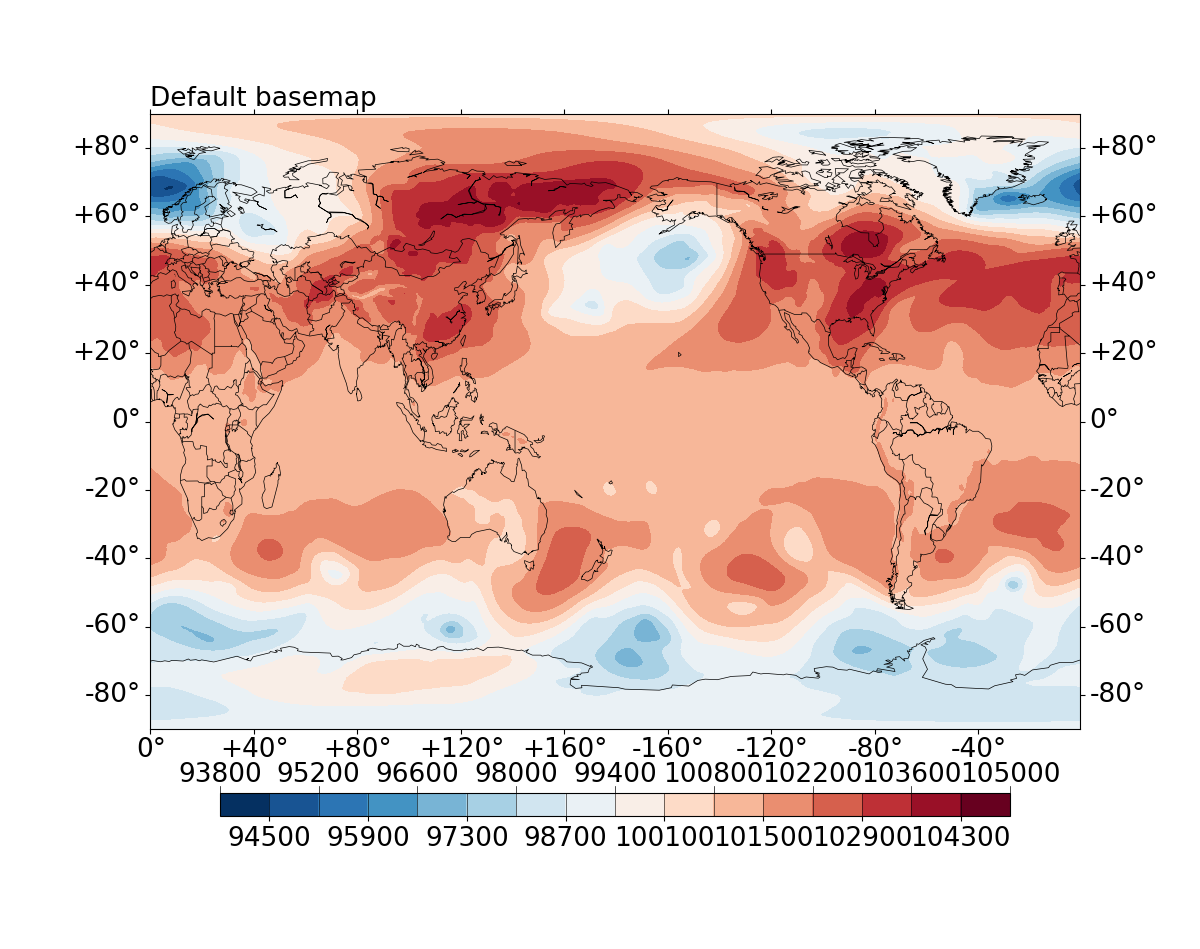
Fig. 1 Default contourf plot of global surface pressure field (in Pa), from ERA-I.
Documentation
gplot module contents
Github and Contact
The code of this package is hosted at https://github.com/Xunius/gplot.
For any queries, please contact xugzhi1987@gmail.com.
Contributing and getting help
We welcome contributions from the community. Please create a fork of the project on GitHub and use a pull request to propose your changes. We strongly encourage creating an issue before starting to work on major changes, to discuss these changes first.
For help using the package, please post issues on the project GitHub page.